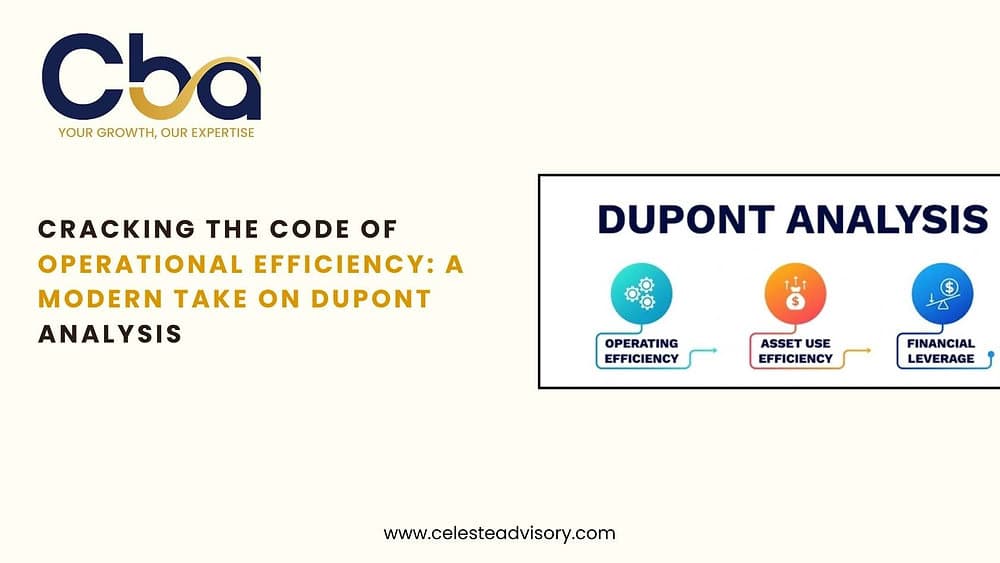
Here is the short answer. DuPont analysis breaks return on equity into three multiplied components: profit margin, asset turnover, and financial leverage. ROE = Net Profit Margin × Asset Turnover × Equity Multiplier. That decomposition matters because two companies with an identical 15% ROE can be completely different businesses, one earning it through fat margins and one through hard-working assets or heavy debt, and the right strategic move is different in each case. Run the three numbers on your own financials and you will know within an hour whether your efficiency problem lives in pricing, in asset utilization, or in the balance sheet.
The framework is roughly a century old, developed inside the DuPont Corporation, and it has survived because it turns one summary number into a diagnosis. In 2026, with cloud ledgers and reporting tools making the inputs available in real time, it is also finally practical for small and mid-sized businesses rather than just equity analysts.
What DuPont Analysis Is
DuPont analysis, also called the DuPont identity, is a financial framework that decomposes return on equity into profitability, operational efficiency, and financial leverage. Return on equity (ROE) is net income divided by shareholder equity: the return the business generates on the owners' invested capital. ROE on its own is a scoreboard; DuPont analysis is the film review that shows how the points were scored. For a business owner, that difference is the whole value. Knowing ROE fell tells you nothing about what to fix. Knowing that margin held steady while asset turnover collapsed points you straight at underused equipment, bloated inventory, or slow receivables.
The Three Components
| Component | Formula | What it measures | How you improve it |
|---|---|---|---|
| Net profit margin | Net income ÷ Revenue | How much of each sales dollar survives as profit | Pricing, cost control, product mix |
| Asset turnover | Revenue ÷ Total assets | How hard the asset base works to generate sales | Inventory discipline, receivables speed, shedding idle assets |
| Equity multiplier | Total assets ÷ Shareholder equity | How much of the asset base is financed by debt rather than equity | Deliberate capital structure, not accidental borrowing |
Multiply the three together and the revenue and asset terms cancel, leaving net income over equity: ROE. The equity multiplier deserves the most caution. A higher multiplier mechanically raises ROE, but it does so by adding leverage, and leverage amplifies bad years exactly as efficiently as good ones. An ROE improvement that comes entirely from the third term is not an efficiency gain; it is a risk transfer.
A Worked Example
Take a manufacturing company with net income of $1,000,000 on revenue of $10,000,000, total assets of $5,000,000, and shareholder equity of $2,500,000.
- Net profit margin = $1,000,000 ÷ $10,000,000 = 10%
- Asset turnover = $10,000,000 ÷ $5,000,000 = 2.0
- Equity multiplier = $5,000,000 ÷ $2,500,000 = 2.0
ROE = 10% × 2.0 × 2.0 = 40%. The headline number is excellent, but the decomposition tells the real story: solid margins, an asset base turning over twice a year, and half the assets funded with debt. If a lender tightened terms and the multiplier fell toward 1.5, ROE would drop to 30% with nothing about operations changing. An owner who only watched the headline would misread that as an operating problem.
Reading the Results: Where the Weakness Lives
Low margin, healthy turnover
This is the classic high-volume, thin-profit pattern, common in retail and distribution. The levers are price, supplier terms, and cost structure. One retail chain we studied ran exactly this profile: a 5% net margin against an industry norm near 10%, asset turnover of 3, and a conservative multiplier of 1.5. Renegotiated supplier contracts and pricing work lifted the margin to 8%, and ROE rose from 22.5% to 36% with no new debt and no operational strain. Margin work of that kind is covered in our guide to maximizing profit margins without raising prices.
Healthy margin, low turnover
Profitable but sluggish: cash sitting in slow inventory, receivables stretching, equipment idle between jobs. The fix is operational, not commercial, and it usually shows up fastest in working capital discipline. Businesses in this pattern often discover that shrinking the asset base does more for ROE than any achievable price increase.
Everything driven by the multiplier
If ROE looks strong only because leverage is high, the business is renting its performance from the bank. Stress-test it: recompute ROE at the margin you earned in your worst recent year, and ask whether the debt service is still comfortable. High leverage with volatile margins is the combination that turns downturns into crises.
Running DuPont Analysis in 2026
The traditional objection, that owners do not have time to compute ratio trees, no longer holds. If your books close monthly in QuickBooks Online or Xero, a reporting layer such as Fathom can track the three components continuously and chart them against prior periods, and AI-assisted reporting tools now surface component-level drift without anyone asking. Two practices make the modern version work. First, trend the components monthly rather than computing them once a year; the direction of each component is more actionable than its level. Second, benchmark against your industry, because a turnover of 2.0 is strong in manufacturing and weak in grocery. DuPont sits naturally alongside the broader ratio toolkit in our comprehensive guide to financial ratios, and feeds the same review rhythm as the KPI set in a CFO's perspective on KPIs.
How to Get Started
- Close your books and confirm the inputs are clean: net income, revenue, total assets, and equity from the same period's statements.
- Compute the three components and ROE for the last eight quarters, not just the current one.
- Identify which component moved the most over that window; that is where your efficiency story lives.
- Benchmark each component against industry peers where data exists.
- Pick one component, assign one initiative against it, and re-measure quarterly.
The discipline matters more than the arithmetic. A DuPont decomposition reviewed once is trivia; reviewed quarterly, it becomes an early-warning system for margin erosion, working capital creep, and quiet leverage growth, the three slowest-moving threats a growing business faces.
Frequently Asked Questions
What is DuPont analysis in simple terms?
DuPont analysis splits return on equity into three multiplied parts: profit margin (how much profit each sales dollar produces), asset turnover (how much revenue each asset dollar produces), and the equity multiplier (how much leverage funds the assets). It shows whether a business earns its returns through pricing, efficiency, or debt.
Why use DuPont analysis instead of just tracking ROE?
Because ROE alone cannot tell you what changed. A falling ROE could mean shrinking margins, underused assets, or deliberate deleveraging, and each demands a different response. The decomposition converts a scoreboard number into a specific diagnosis you can act on.
What is a good ROE for a small business?
It varies widely by industry and leverage, so treat published averages with care. The more useful tests are direction and composition: ROE trending up over several quarters, driven by margin or turnover rather than by added debt, is healthy at almost any absolute level.
Does a high equity multiplier mean a business is in trouble?
Not by itself. Leverage is a legitimate tool, and capital-intensive industries run structurally higher multipliers. The warning sign is a rising multiplier combined with thin or volatile margins, because that pairing means a modest downturn can wipe out the equity cushion the ROE was built on.
How often should I run a DuPont analysis?
Quarterly is the practical rhythm for most small and mid-sized businesses, with the three components trended monthly if your reporting stack makes that cheap. The value compounds over time, since the trend in each component matters more than any single reading.
The Bottom Line
DuPont analysis endures because it answers the question every owner eventually asks: my returns changed, so what exactly changed underneath? Margin, turnover, and leverage each point to a different fix, and multiplying them back together keeps you honest about whether performance is earned or borrowed.
If you want the decomposition built into your monthly reporting, with benchmarks and a plan against the weak component, our FP&A service does this work for US businesses, backed by a team of CPAs and CMAs with Fathom, Xero, and QuickBooks certifications. Talk to us and we will run the first analysis with you.